Another article by Morten Geertsen
Cutting to the core: Numbers across emerging gaming countries
Previously, markets such as social gaming in Brazil and gambling in Mexico have been covered to give some perspective on the global gaming market – and to inspire readers from the established gaming markets, Europe and America, with stories and reports from emerging markets. Today we’re hitting some hard facts, drawing comparisons and highlighting differences between some of the world’s emerging gaming markets, when referring some of the statistics presented in last summer’s report, Monetizing Emerging Games’ Markets. These will be America, Spain, Russia, Brazil and Mexico.
Which platforms are the most popular?
Anyone wondered what the most popular platform is right now – console games, mobile devices or casual websites? We see that overall mobile is in fact the 'biggest' platform. In most countries it is among the top three in terms of number of gamers per platform. Although for many readers this might of no surprise, this means that the number of players on the move has leveled to a very impressive height. However the different between casual website gamers, mobile device gamers and console gamers rarely differs much between the five countries, America, Spain, Russia, Brazil and Mexico.
Who plays vs. who pays?
When looking at the payers vs. players ratio for massive multiplayer role playing games (MMO), it becomes clear that the US not only has the highest number of MMO payers but also by far the highest percentage of MMO payers compared to Spain and emerging markets. 43% of all MMO players in the US pay for MMO games. In emerging markets, the average percentage of MMO payers is about 35% of all MMO players.
Zooming in on social game payers vs. players ratios, it can be said that the percentage of payers amongst social players is on average (almost) equal when comparing the US with emerging markets. Social payer’s percentages vary between 25 and 27% in these countries. With only 16% of social players actually paying for social games in Spain, it becomes clear that Spanish social gamers are not keen on paying for it. However, when looking at the actual social payers, Spaniards are in fact spending the most on average per month on social games (€7,62 per month).
What is the business models used?
There’s model of subscription payments, where players as an example for a month at a time, and there is the virtual item payment method. Only in Spain, subscription based payments are used more often than buying virtual items within social games. The difference between paying via subscription or virtual item is more significant when looking at Russia, Brazil, and Mexico. For MMOs this is different, where subscriptions are in higher demand than virtual items for the US and Spain. For emerging markets, the difference between the two payment methods is less for MMO games than for Social games. These numbers do not indicate the amount of money spent but the absolute number of paying gamers via subscriptions or virtual items.
How do they pay?
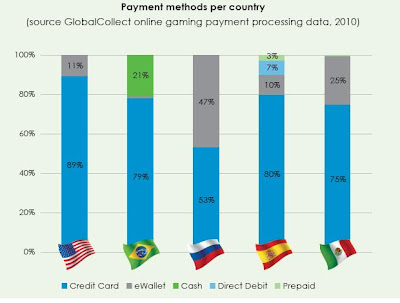
When asked how social and MMO players pay for their games, it becomes clear that credit cards are the number one payment method in the US and Brazil. As much as 42% of the Brazilian MMO payers state that credit cards are one of their preferred payment methods. Overall, credit cards and online payment services are the most popular payment methods amongst social and MMO followed by text messaging. Whereas credit cards perform best in the US and Brazil, online payment methods are more popular in Russia, Mexico, and Spain.
Is there other significant payment methods?
Yes, even if cards are dominating most markets, each country shows quite specific local payment preferences (as illustrated above). Brazilian players have less access to credit cards and PayPal than American ones, which have resulted in some monetization problems for foreign companies as stated in . Consequently, they rely on cash-based payments like Boleto (21% local market share overall; up to 40% market share for fully localized online gaming merchants). Russia is all about local eWallets and terminal payments like Qiwi.
What are the transactions across the countries?
It should come as no surprise that players from emerging countries have a lower purchasing power which is reflected in their average spent per purchase (25% less than American players on average). This explains why localized offers are usually set at a lower price point for both game clients and services in these countries - sometimes with Western pricing strategies sustained via multiple monthly installments (such as 1/6 of the price per month over six months).
All data derived from Newzoo - thanks guys!


All the graphics are gone.
ReplyDelete